Index
4.2 Acoustic tagging page
This section is designed to provide a comprehensive overview of the tools and features available within the acoustic tagging page. Jump ahead to the section on methods if you're looking for more details on tagging methods for species identification.
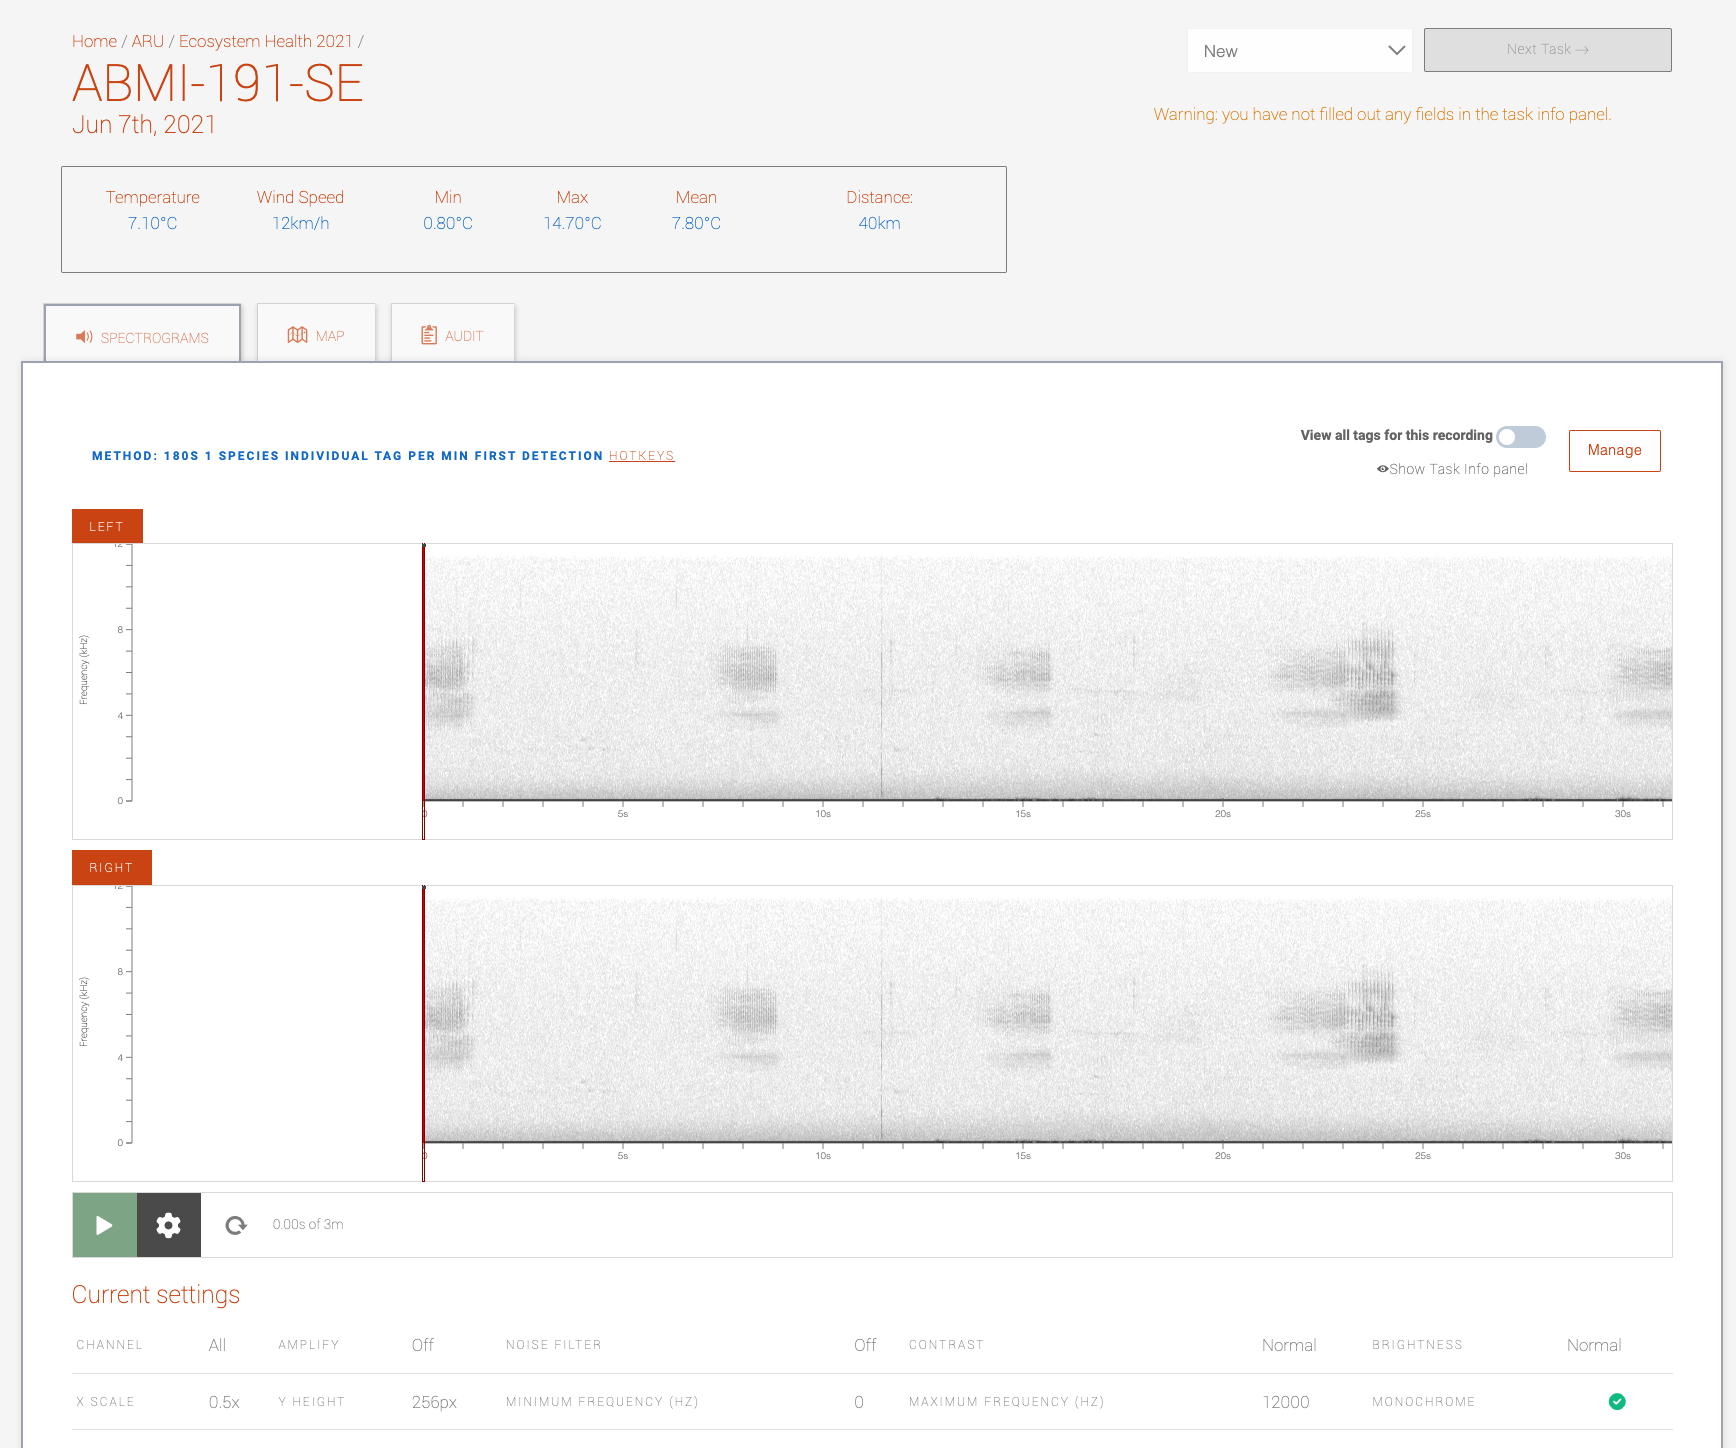
- Spectrogram Interface: Here is where tagging will take place through various methods described below. You can interact with the spectrogram via the hotkeys.
- Logged Sounds: This is a running list of the detection history of species and individuals in the recording that you have tagged.
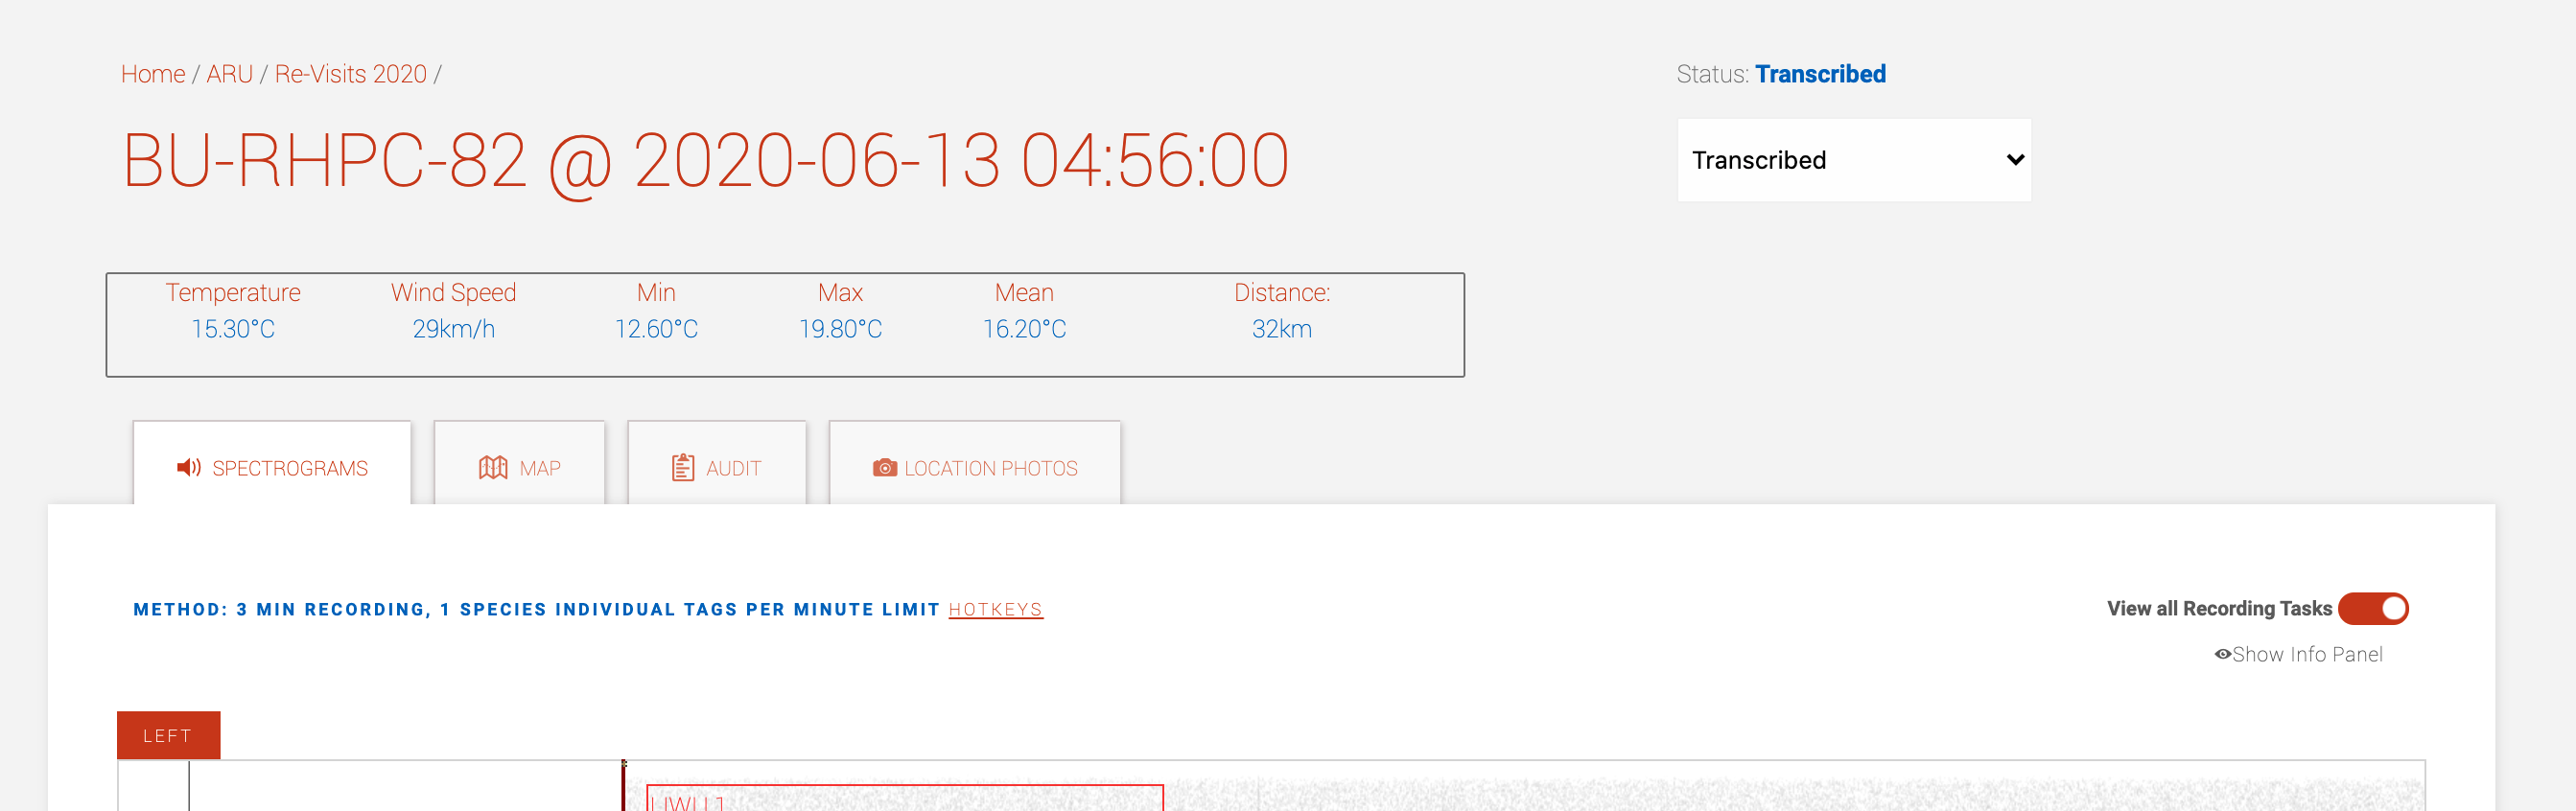
- Header: Here you can navigate back to the project page using the breadcrumb, see the organization, location and date time of the task you’re working on, the task status and the weather conditions.
A spectrogram is a visual representation of the acoustic energy in a recording created using a short-time Fourier transform (STFT). The x-axis corresponds to time, the y-axis to frequency and the z-axis (or how dark the signal is) to amplitude. Spectrograms in WildTrax are generated with a command line software called SoX. Audio file types have been calibrated to create the "best looking" spectrograms.
Task Info
Clicking on the  icon at the top right corner of the spectrogram
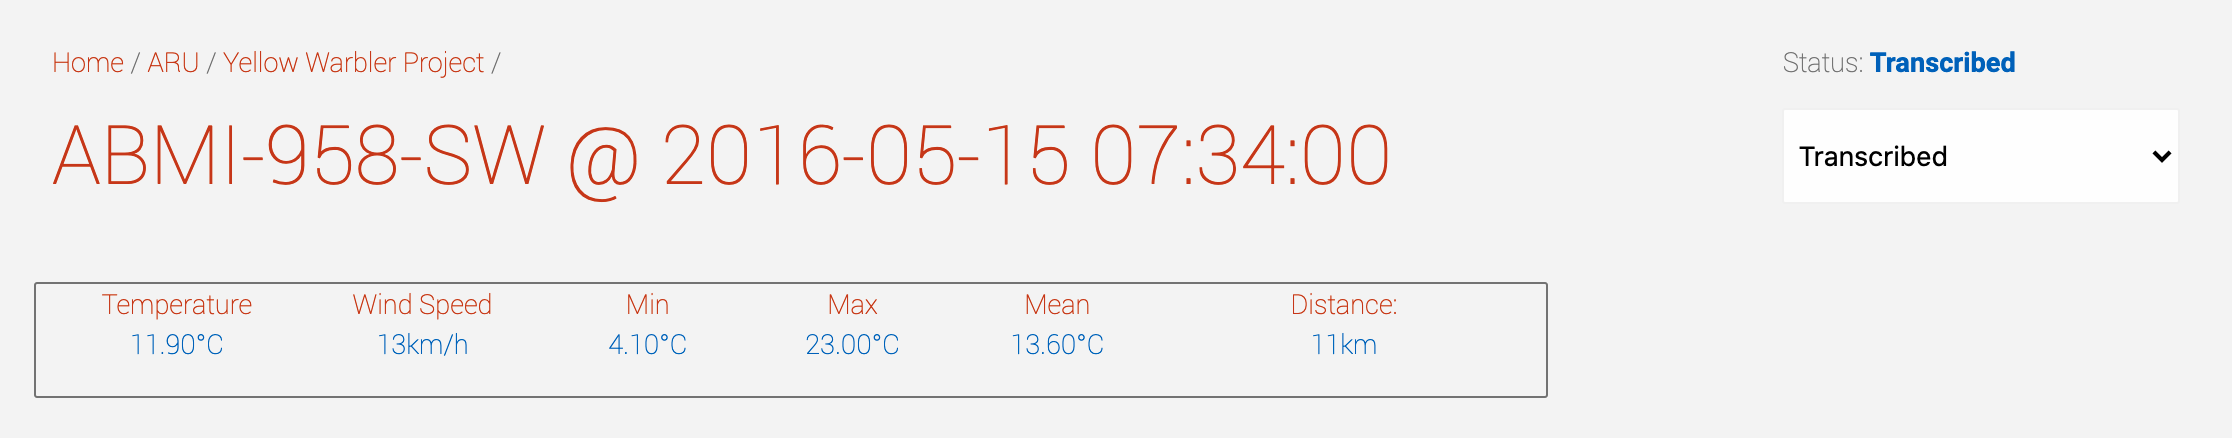
 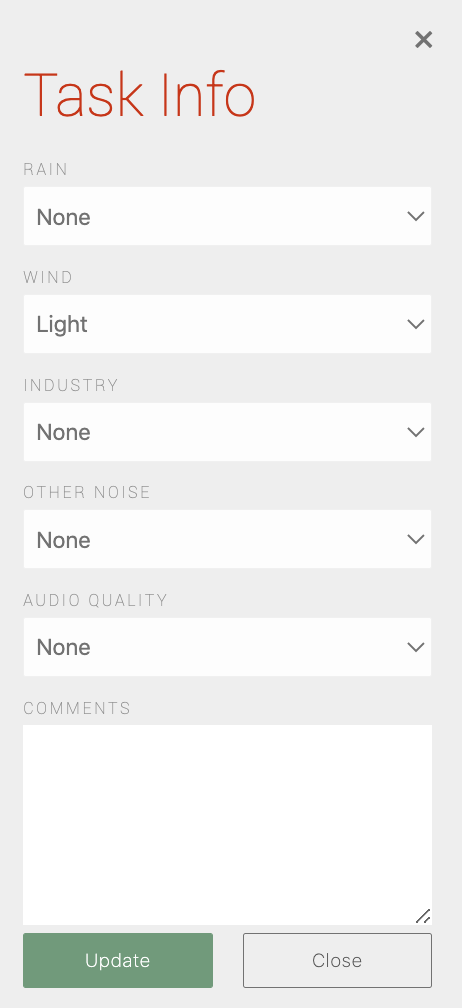 shows the Task Info panel. This table contains fields that describe average metadata for the task such as abiotic noise levels and audio quality. These are optional to be filled in before the task is set to Transcribed otherwise a warning will appear. Average noise assessments and audio quality are filled in after the tagging is complete.
- Rain: average rain on the task
- Wind: average wind on the task
- Industry: average chronic industrial noise on the task
- Noise: average background noise on the task (intermittent and other abiotic noise)
- Audio quality: overview of the audio quality of the task
- Comments: any general comments or descriptions to make about the task
There are options for tagging abiotic noise sources. See Acoustic tagging methods for more information.
Spectrogram controls and audio settings

Audio editing controls have been implemented in WildTrax using hotkeys allowing easy navigation through a task. Hovering over the panel above the spectrogram will remind you how to use these controls at any time if you forget.
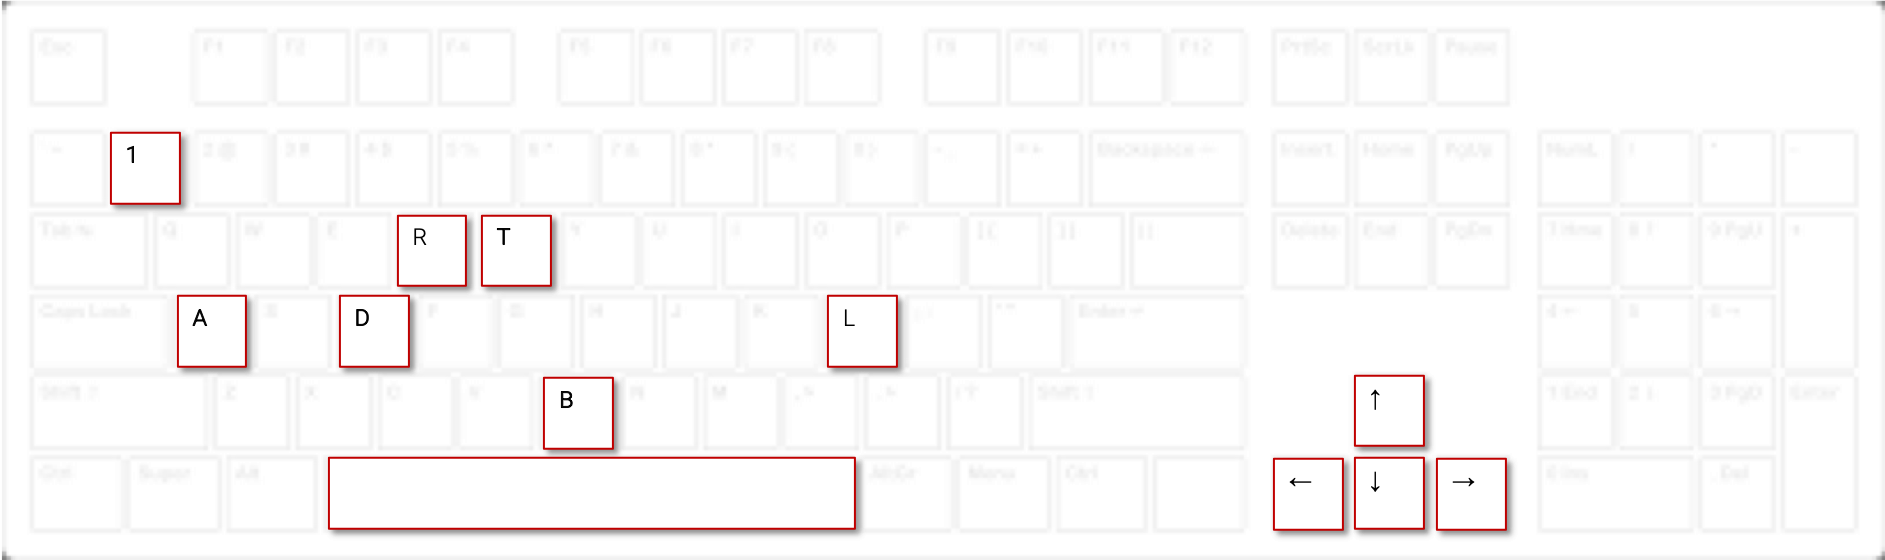
- Z: Jump back 10 seconds
- M: Jump forward 10 seconds
- B: Toggle display for boxes
- T: Toggle display for species | individual text
- L: Show / hide tags on the left channel
- R: Show / hide tags on the right channel
- Left Arrow: Previous marker
- Right Arrow: Next marker
- Up Arrow: Go to the first marker
- Down Arrow: Go to the last marker
- Spacebar: Pause / Play
- Tab: Move between fields
- 1: Create a marker
- Enter: Select within a field
You can dynamically set the audio settings which control the spectrogram and audio parameters of the recording for the task. These settings are set by default at the project level by an administrator but you can change them at any time while processing a task. You can set the audio settings by either clicking on the gear icon below the spectrogram or going to Manage > Audio Settings above and to the right of the spectrogram. When you have your desired settings, click Apply or Reset to the project defaults.
- Channel: Set the default channel that will display on the screen (left, right or both)
- Amplify: Increase the gain or amplitude of the audio to hear faint sounds
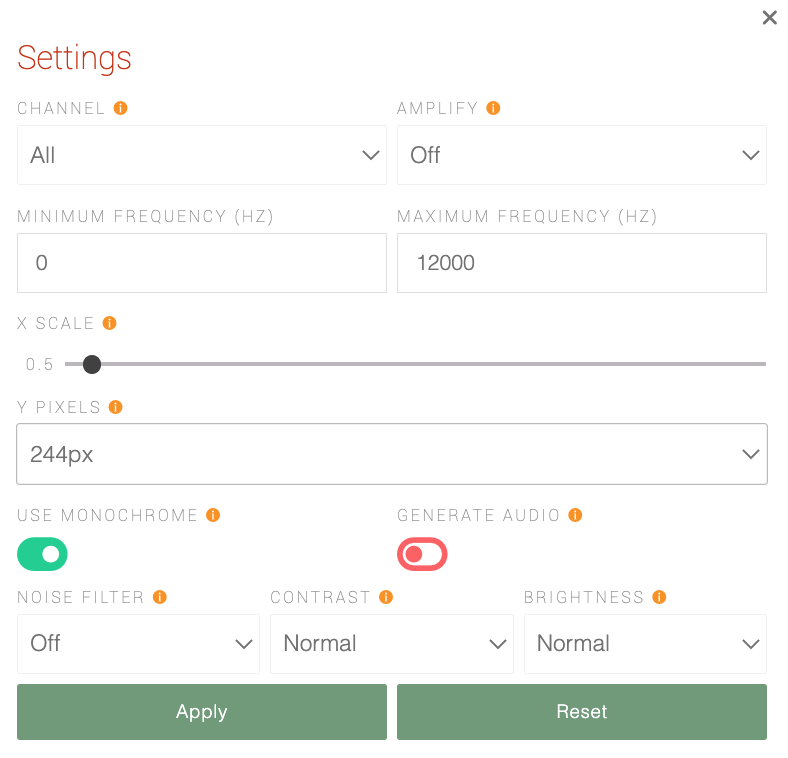
- Minimum and Maximum Frequency (Hz): The minimum and maximum bounds displayed on the spectrogram. The audio will be played for the entire spectrum unless the Generate Audio toggle is enabled.
- X Scale: Use the slider to change the amount of seconds displayed on the spectrogram. A lower value will display more time whereas a larger value will display less time.
- Y Height: The spectrogram height in pixels. A larger number will increase the vertical dimension of the spectrogram
- Use Monochrome: When toggled on, displays spectrogram in a monochrome format (black and white). Toggle off to display colour spectrogram.s
- Generate Audio: When toggled on, only the audio between the selected frequency ranges will be played.
- Noise Filter: Attempts to apply a noise filter to better help hear the signal.
- Contrast: Contrast range in dB. Default is 120 dB. This sets the dynamic-range of the spectrogram to be the selected value dBFS to 0 dBFS. This may range from 20 to 180 dBFS. Decreasing dynamic-range effectively increases the ‘contrast’ of the spectrogram display, and vice versa.
- Brightness: Sets the upper limit of the Z-axis in dBFS. A negative number effectively increases the ‘brightness’ of the spectrogram display, and vice versa.
Tags
The boxes that comprise the tag are the fundamental way that WildTrax differs from many other audio tagging systems: they allow you to enclose a species detection in real-time while providing information about vocalization frequency, length and amplitude using the dimensions of the box. When a box is drawn on the spectrogram, WildTrax requires you to enter species metadata after it is created, which pauses the recording while the metadata is being added.
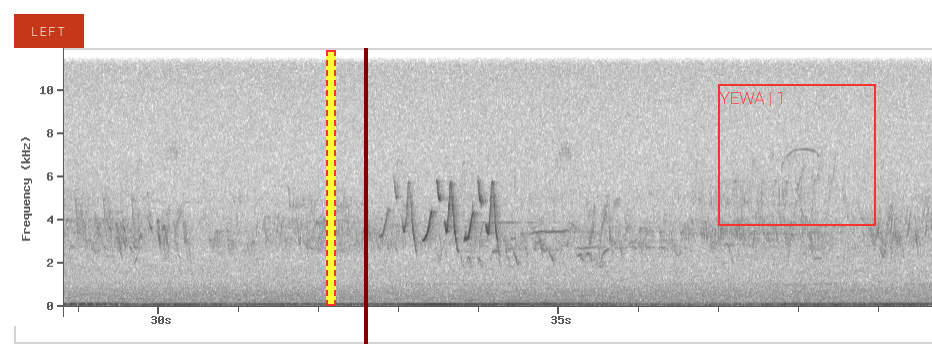
In contrast, you can use markers to indicate where a signal is detected without stopping the playback. You'll still need to return later to each marker, draw a box, and enter the appropriate species metadata but this way you can rapidly annotate the vocalizations you want. WildTrax offers these two different ways to tag species to allow you to create your own work flow for data processing.
When a signal is detected, click and drag on the spectrogram to create a box. Draw the box around the outside of the signal. Depending on your study design, you may want to include harmonic frequencies. Once you’ve drawn the box, the Add New Tag window will pop up on the right-side of the spectrogram.
There are a minimum set of rules that WildTrax uses to create tags. As the system develops, new rules may be applied in the future. Project administrators are invited to instruct their members to annotate species as necessary for the objectives of the project.
-
Tagging restrictions
- Tags are a minimum of 0.1 seconds and a maximum of 20 seconds long as defined by the constraints of the maximum dimensions of the spectrogram currently employed in WildTrax
- Tags will always have a minimum frequency of 0 Hz and a maximum frequency of 12,000 Hz as defined by the constraints of the maximum dimensions of the spectrogram
- Regardless of spectral coverage, a tag must always have minimum dimensions of 0.1 seconds and 200 Hz otherwise the tag will automatically disappear (in reality the tag must have a minimum size of 5 x 5 pixels)
- Depending on what method is applied to the task, the number of tags per species-individual you can make may be restricted
-
Tagging recommendations
- The tag should enclose the whole signal
- The tag should be as “tight” as possible around the signal leaving as little space as possible
- The tag should capture important vocalization patterns and repetitions
The fields associated with each tag are as follows:
- Species: This field is a dropdown that operates through detecting text either by a modified version of the American Ornithology code system or the English common name of the species.
- Individual: This field corresponds to uniquely identified individuals of a species on the recording. In other words, if you hear two Ovenbirds (OVEN), the first individual would be tagged as “1” and the second OVEN as “2”. WildTrax has been designed to automatically populate the Individual field as new data is being entered. Therefore, if you forget to add in the individual number, the system will update it for you automatically in sequence.
- Needs Review: This checbox flags tags for expedited verification or if you're not confident in the identification of the species or the tag metadata
- Abundance: This field stores abundance information for each detection. It is broken down into two main categories: for amphibian calling intensity (CI) and all other species (1-10 and TMTT).
- Vocalization Type: This field describes the type of vocalization each detected species/individual made. Vocalization type can be changed for each individual in each minute interval as well. The current options are song, call and non-vocal.
- Comments: Use this field liberally to make notes about any of the songs or calls relating to the species in question, especially in the case of unknowns.
At any time during tagging you can edit the information stored for each tag either by clicking on the box, or visiting the logged sounds table. Once you click on the box, you can change the dimensions, position or the metadata for any of the fields when the tag panel is open. You can even change the species code of the tag in case it was, for example, accidentally misidentified or you wanted to change it to an unknown. You can also delete the tag altogether.
Logged sounds table
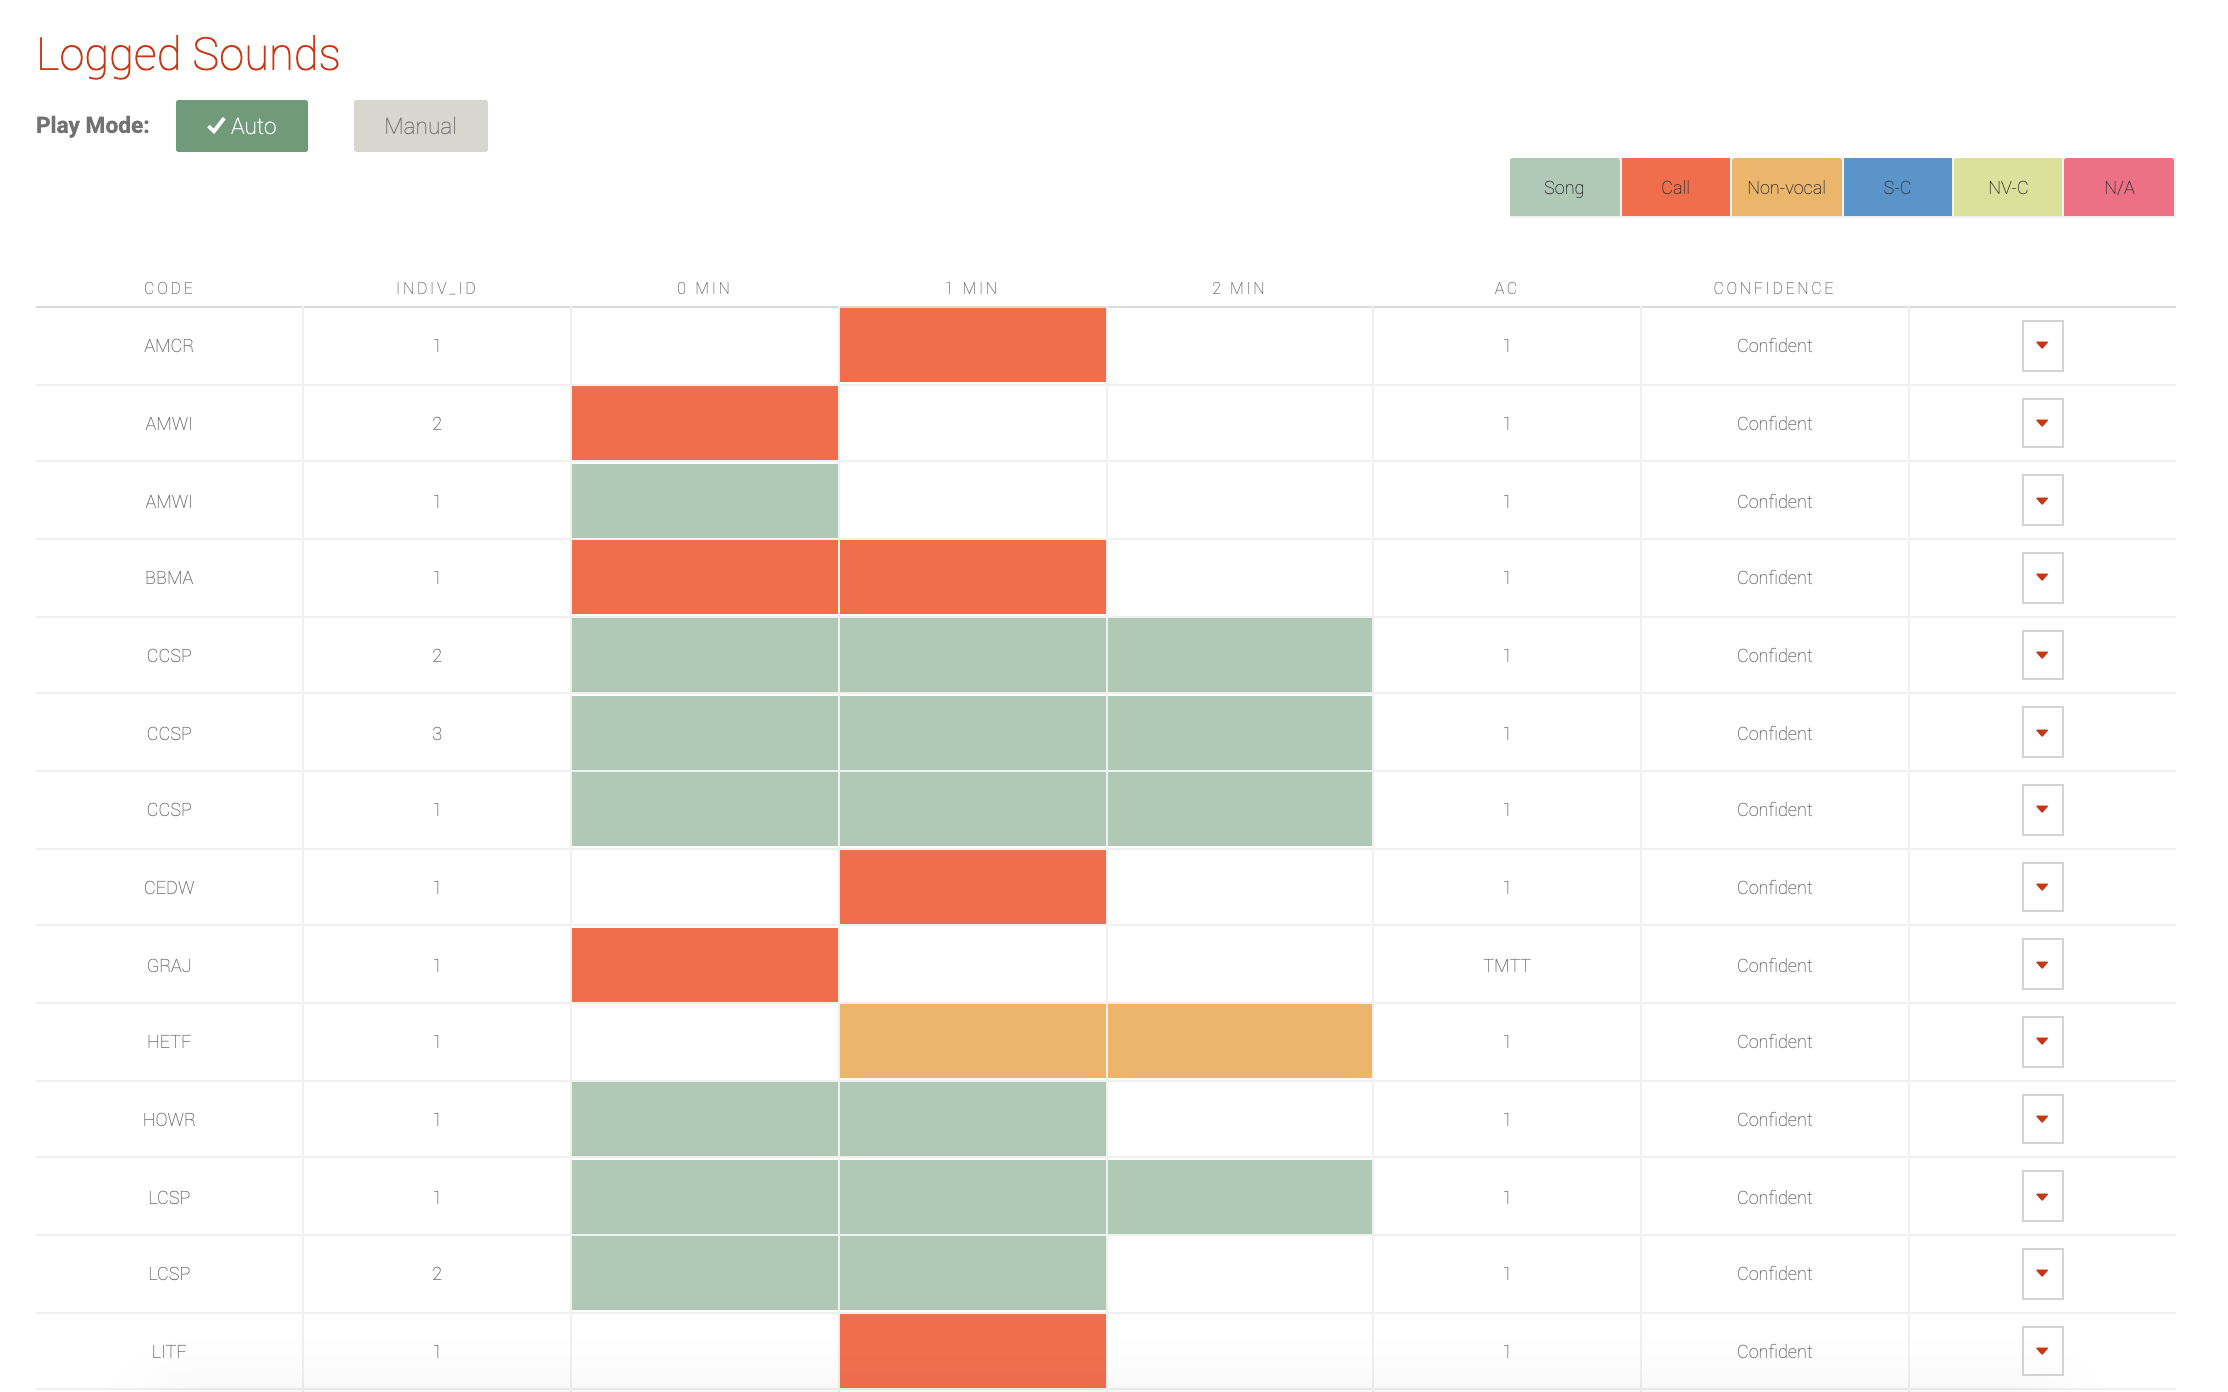
Every time a tag is made, the information is saved below the spectrogram in the logged sounds table. This is a running list of all of the detections that are currently in the task. The table lets you keep track of the species and individuals that are already tagged and provides another place to edit tags.
Components of the table include the species code, the minute intervals where the species was detected (where applicable depending on method), the abundance, the vocalization type of the species (shaded in different colours to allow ease of visualization) and the confidence of the identification. If you hover over a coloured cell, you can also see the second within the minute interval that the box was created, and by clicking on the cell, WildTrax will transport you directly to the part of the spectrogram where the species was detected and play the recording (if Auto play mode is selected).
This will also open the Tag panel. Clicking on the ![]() beside the Confidence field will also let you navigate back to the species detection and make edits in the Tag panel. The switch just below the spectrogram
beside the Confidence field will also let you navigate back to the species detection and make edits in the Tag panel. The switch just below the spectrogram 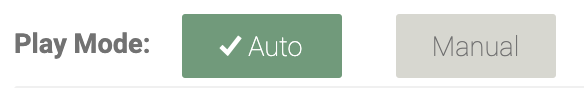 allows you to toggle auto-playing the recording when you navigate to a tag.
Task status
As discussed before, the task is a unique combination of user, processing method and recording - the task status indicates its processing state.
If you've been assigned a task and you're a read-only project member, your privileges to the task status field will be slightly different in that if you switch the task to Bad Weather, Malfunction or Transcribed you will not be able to switch it back to an unprocessed status.
Go to the header when you’ve completed tagging and you wish to move to another task. Here, you can change the task status to Transcribed and then click on the  icon to process another task. There are other options to choose from in order to annotate the status of the task; for example, if you wish to leave the task but tags have not been completed, select In Progress.
If a tag is created in any task, the status will automatically change to In Progress as a reminder that you visited the task.
Here are some in-depth descriptions of the task statuses and what they mean.
Unprocessed or incomplete processing
-
New
The task was either recently assigned or no tags have been made yet.
-
In Progress
In Progress is a general usage status for a task that is currently being processed, or that needs to be re-processed for any reason. Once a tag has been made, the task status will automatically switch to In Progress.
-
Review
Use this status if you are a read-only member and you need to flag to your project administrator tasks to audit or if you are a project administrator and you want a tagger to review an assignment.
Processed
-
Bad Weather
Sometimes you might upload media into your project that is unsuitable for tagging. You can flag these assigned tasks as Bad Weather (e.g. due to wind, rain) so they don't get processed. Use the weather conditions panel simultaneously to make a decision on the weather suitability.
-
Malfunction
If you detect any malfunctions with your acoustic media, such as channel failures or poor audio quality that does not allow you to process the task, use this setting to indicate no processing took place due to the errors.
Note: You can indicate the details of the malfunction in the audio quality field in the task info panel and in the task comments.
-
Transcribed
Switch the task to Transcribed to indicate you've completed the task!
Weather conditions
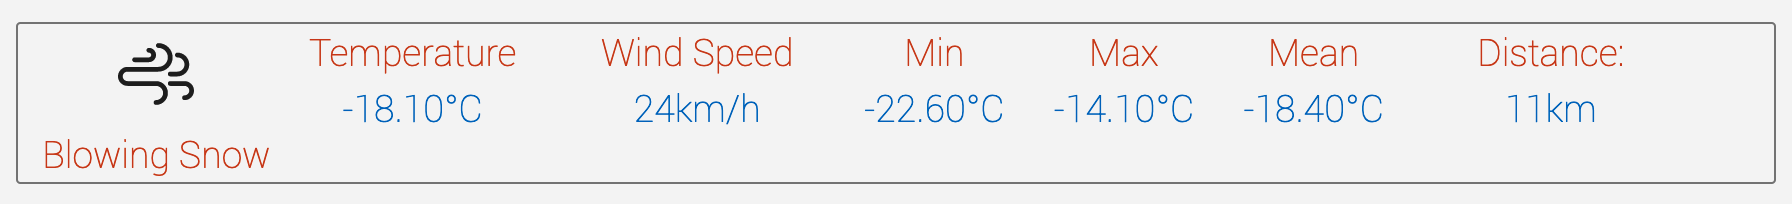
Conditions recorded at the nearest weather station (at the nearest time to when the ARU recording took place) are located in the panel just above the spectrogram. Clicking on the panel opens the detailed weather information panel describing both hourly and daily conditions recorded at weather stations within a maximum radius of 155 km. You can toggle through the list of stations with the  and
and  buttons to get the conditions recorded at various stations.
Note: Getting weather conditions requires that locations have spatial metadata.
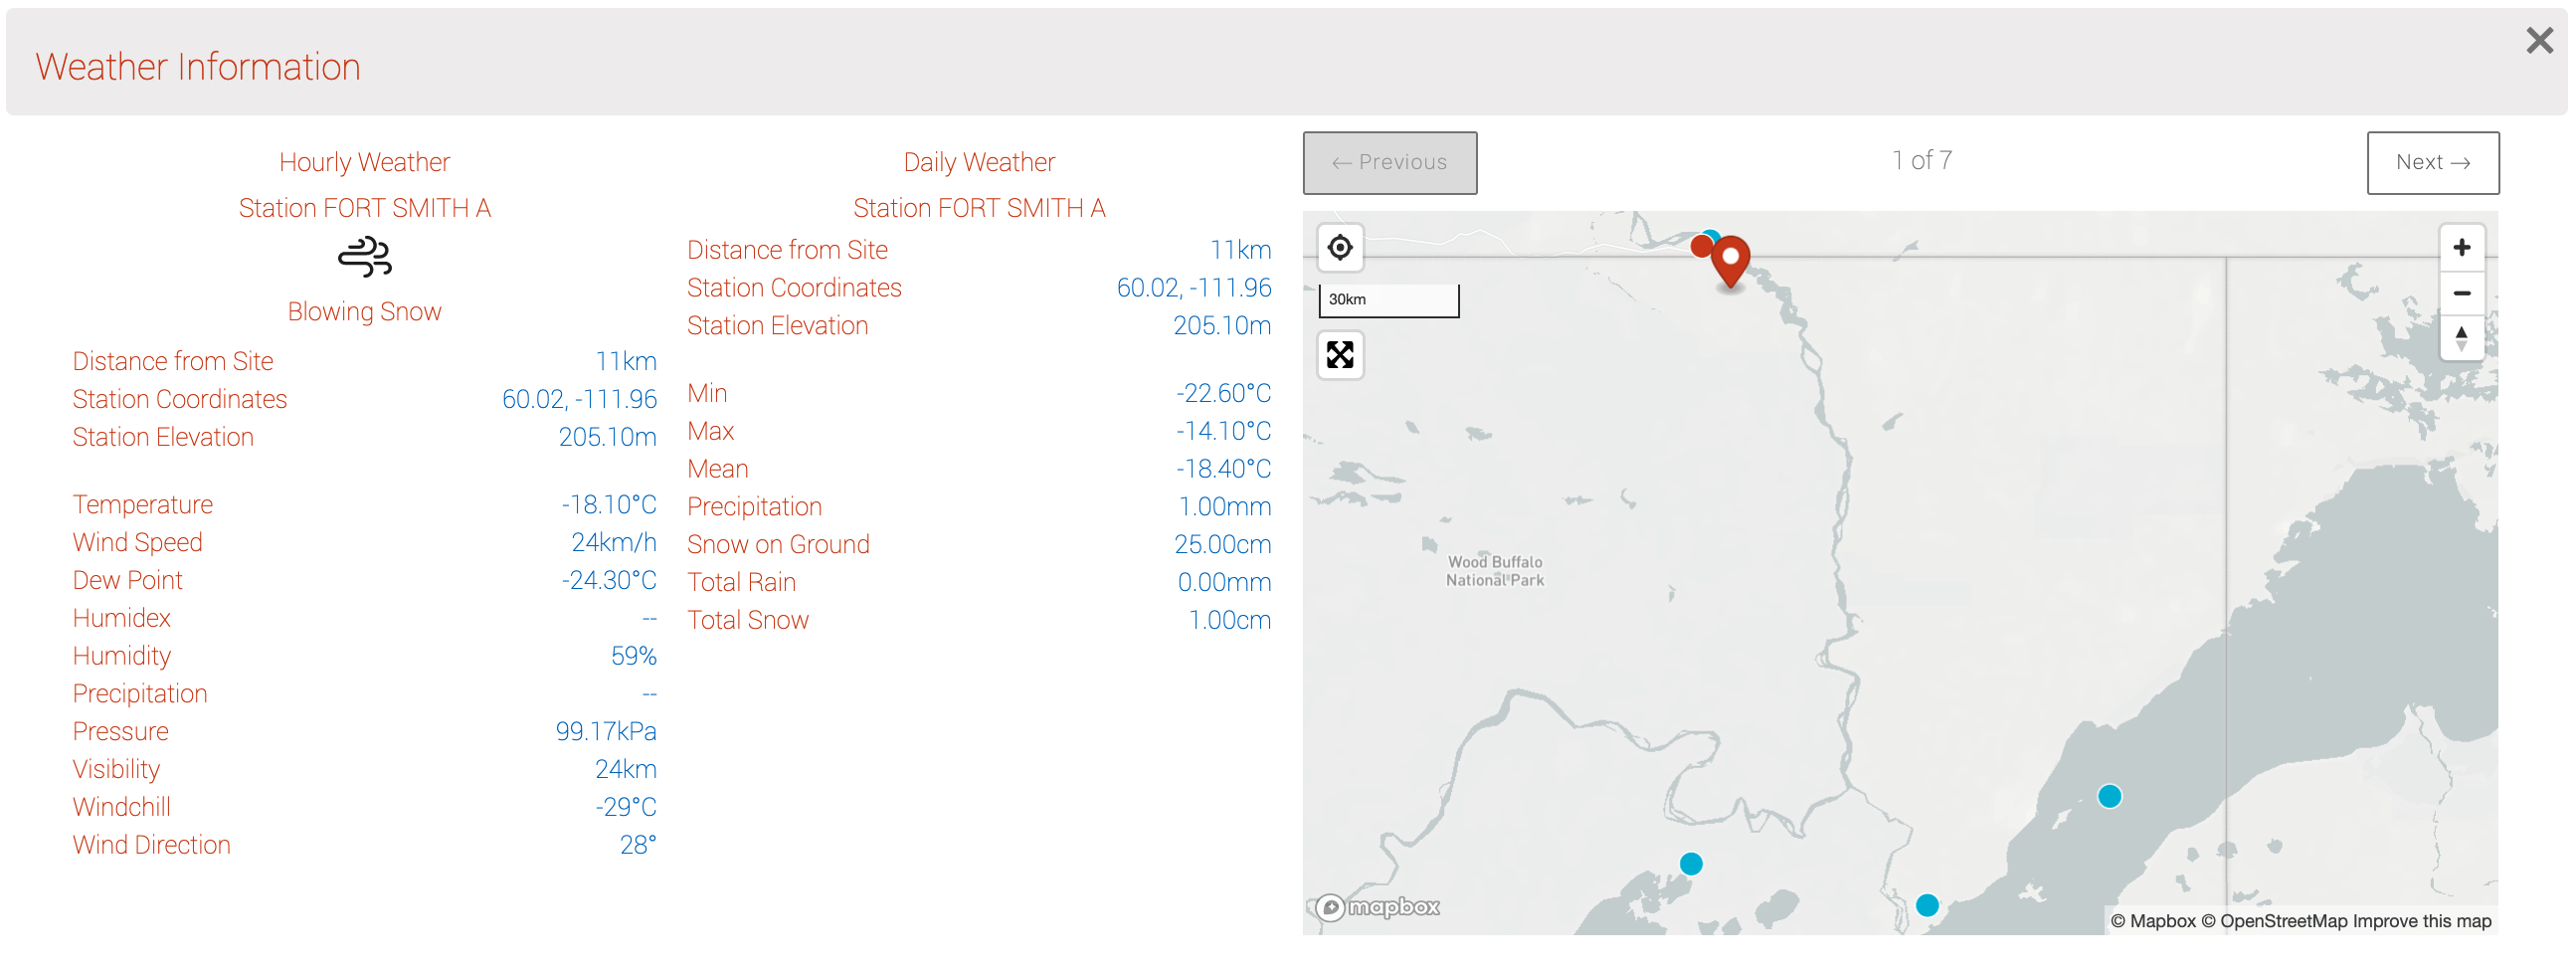
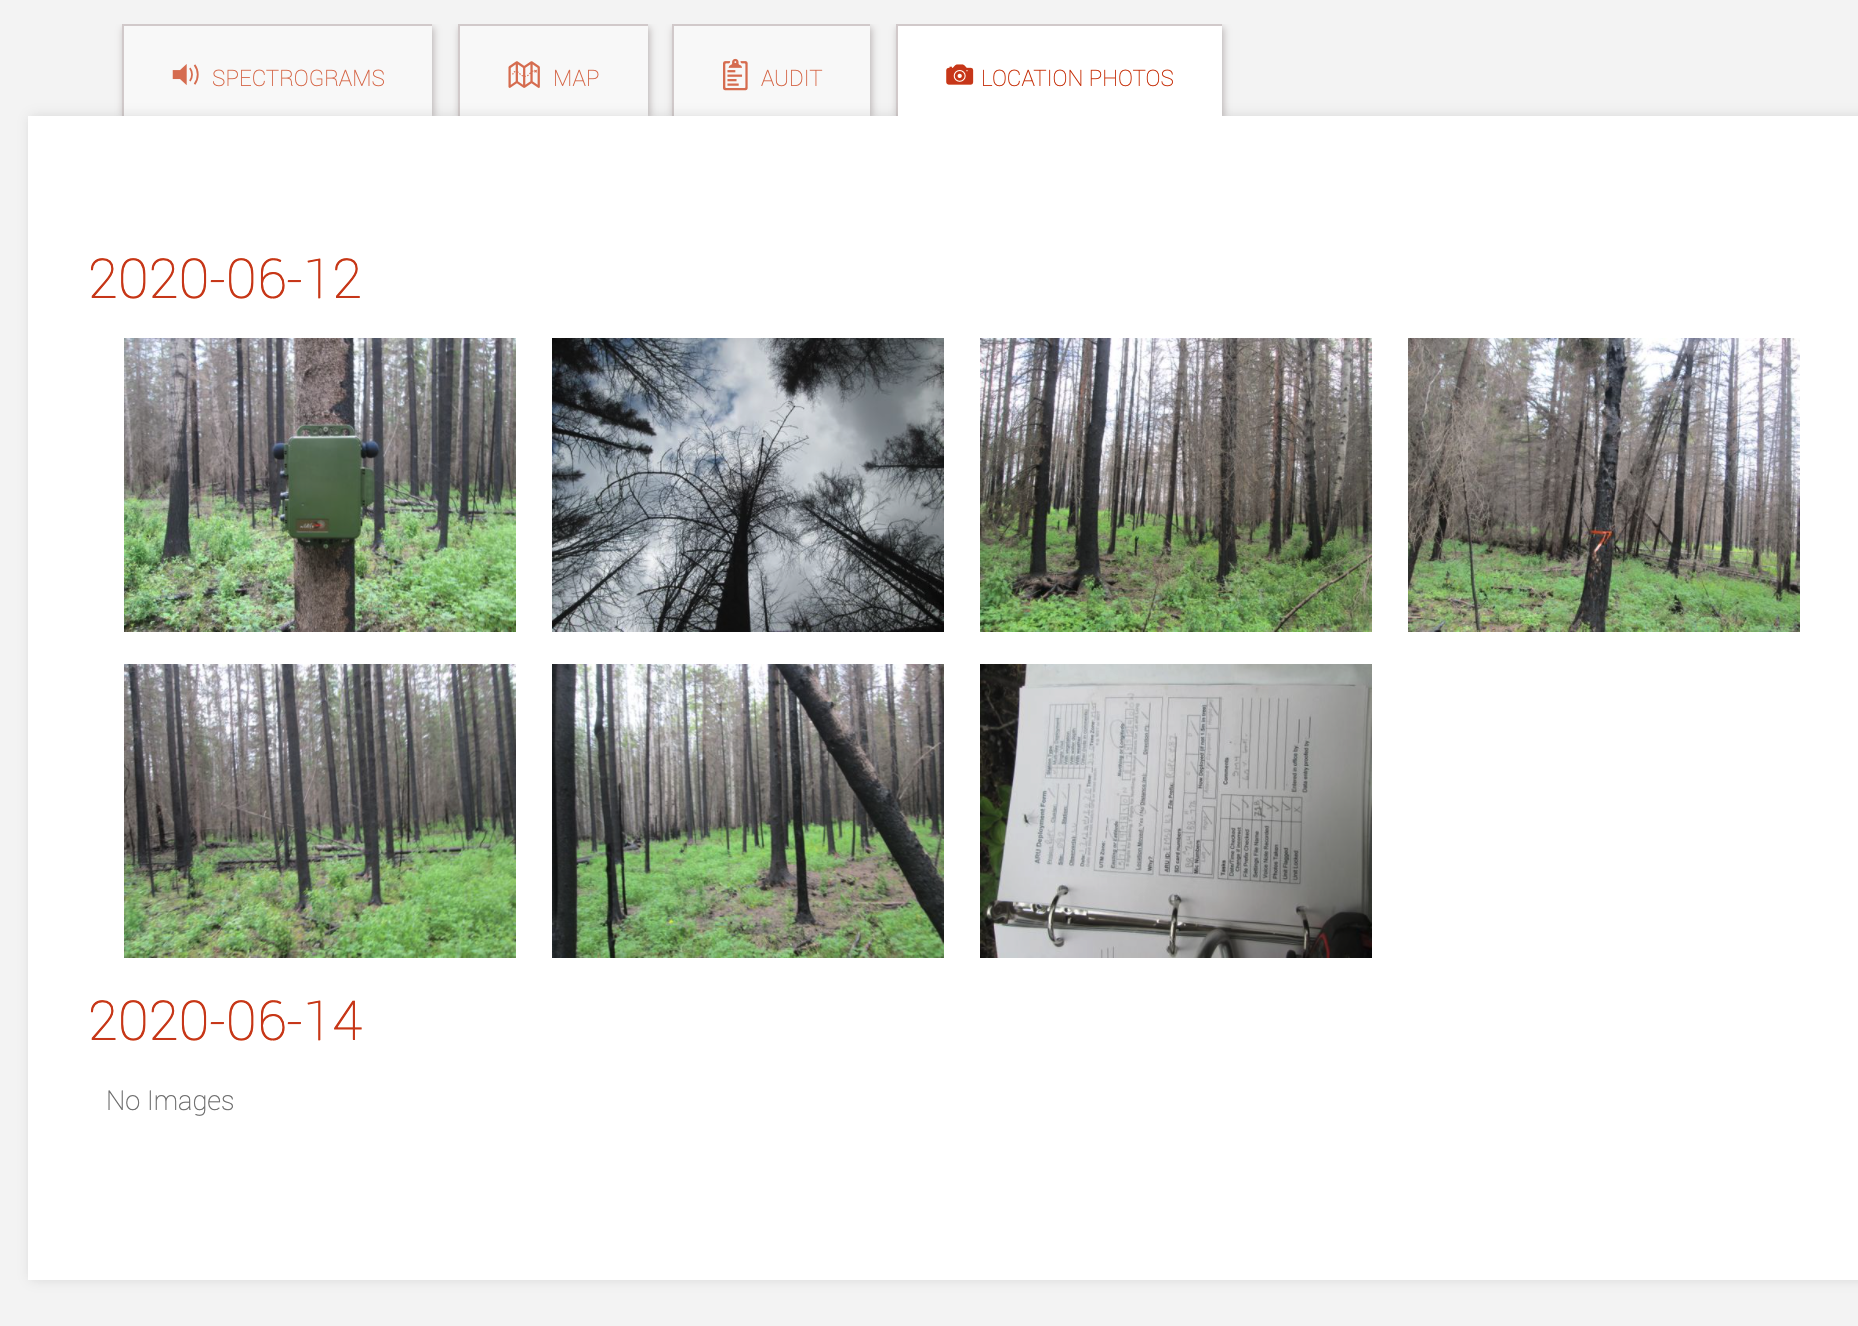
Map and location photos